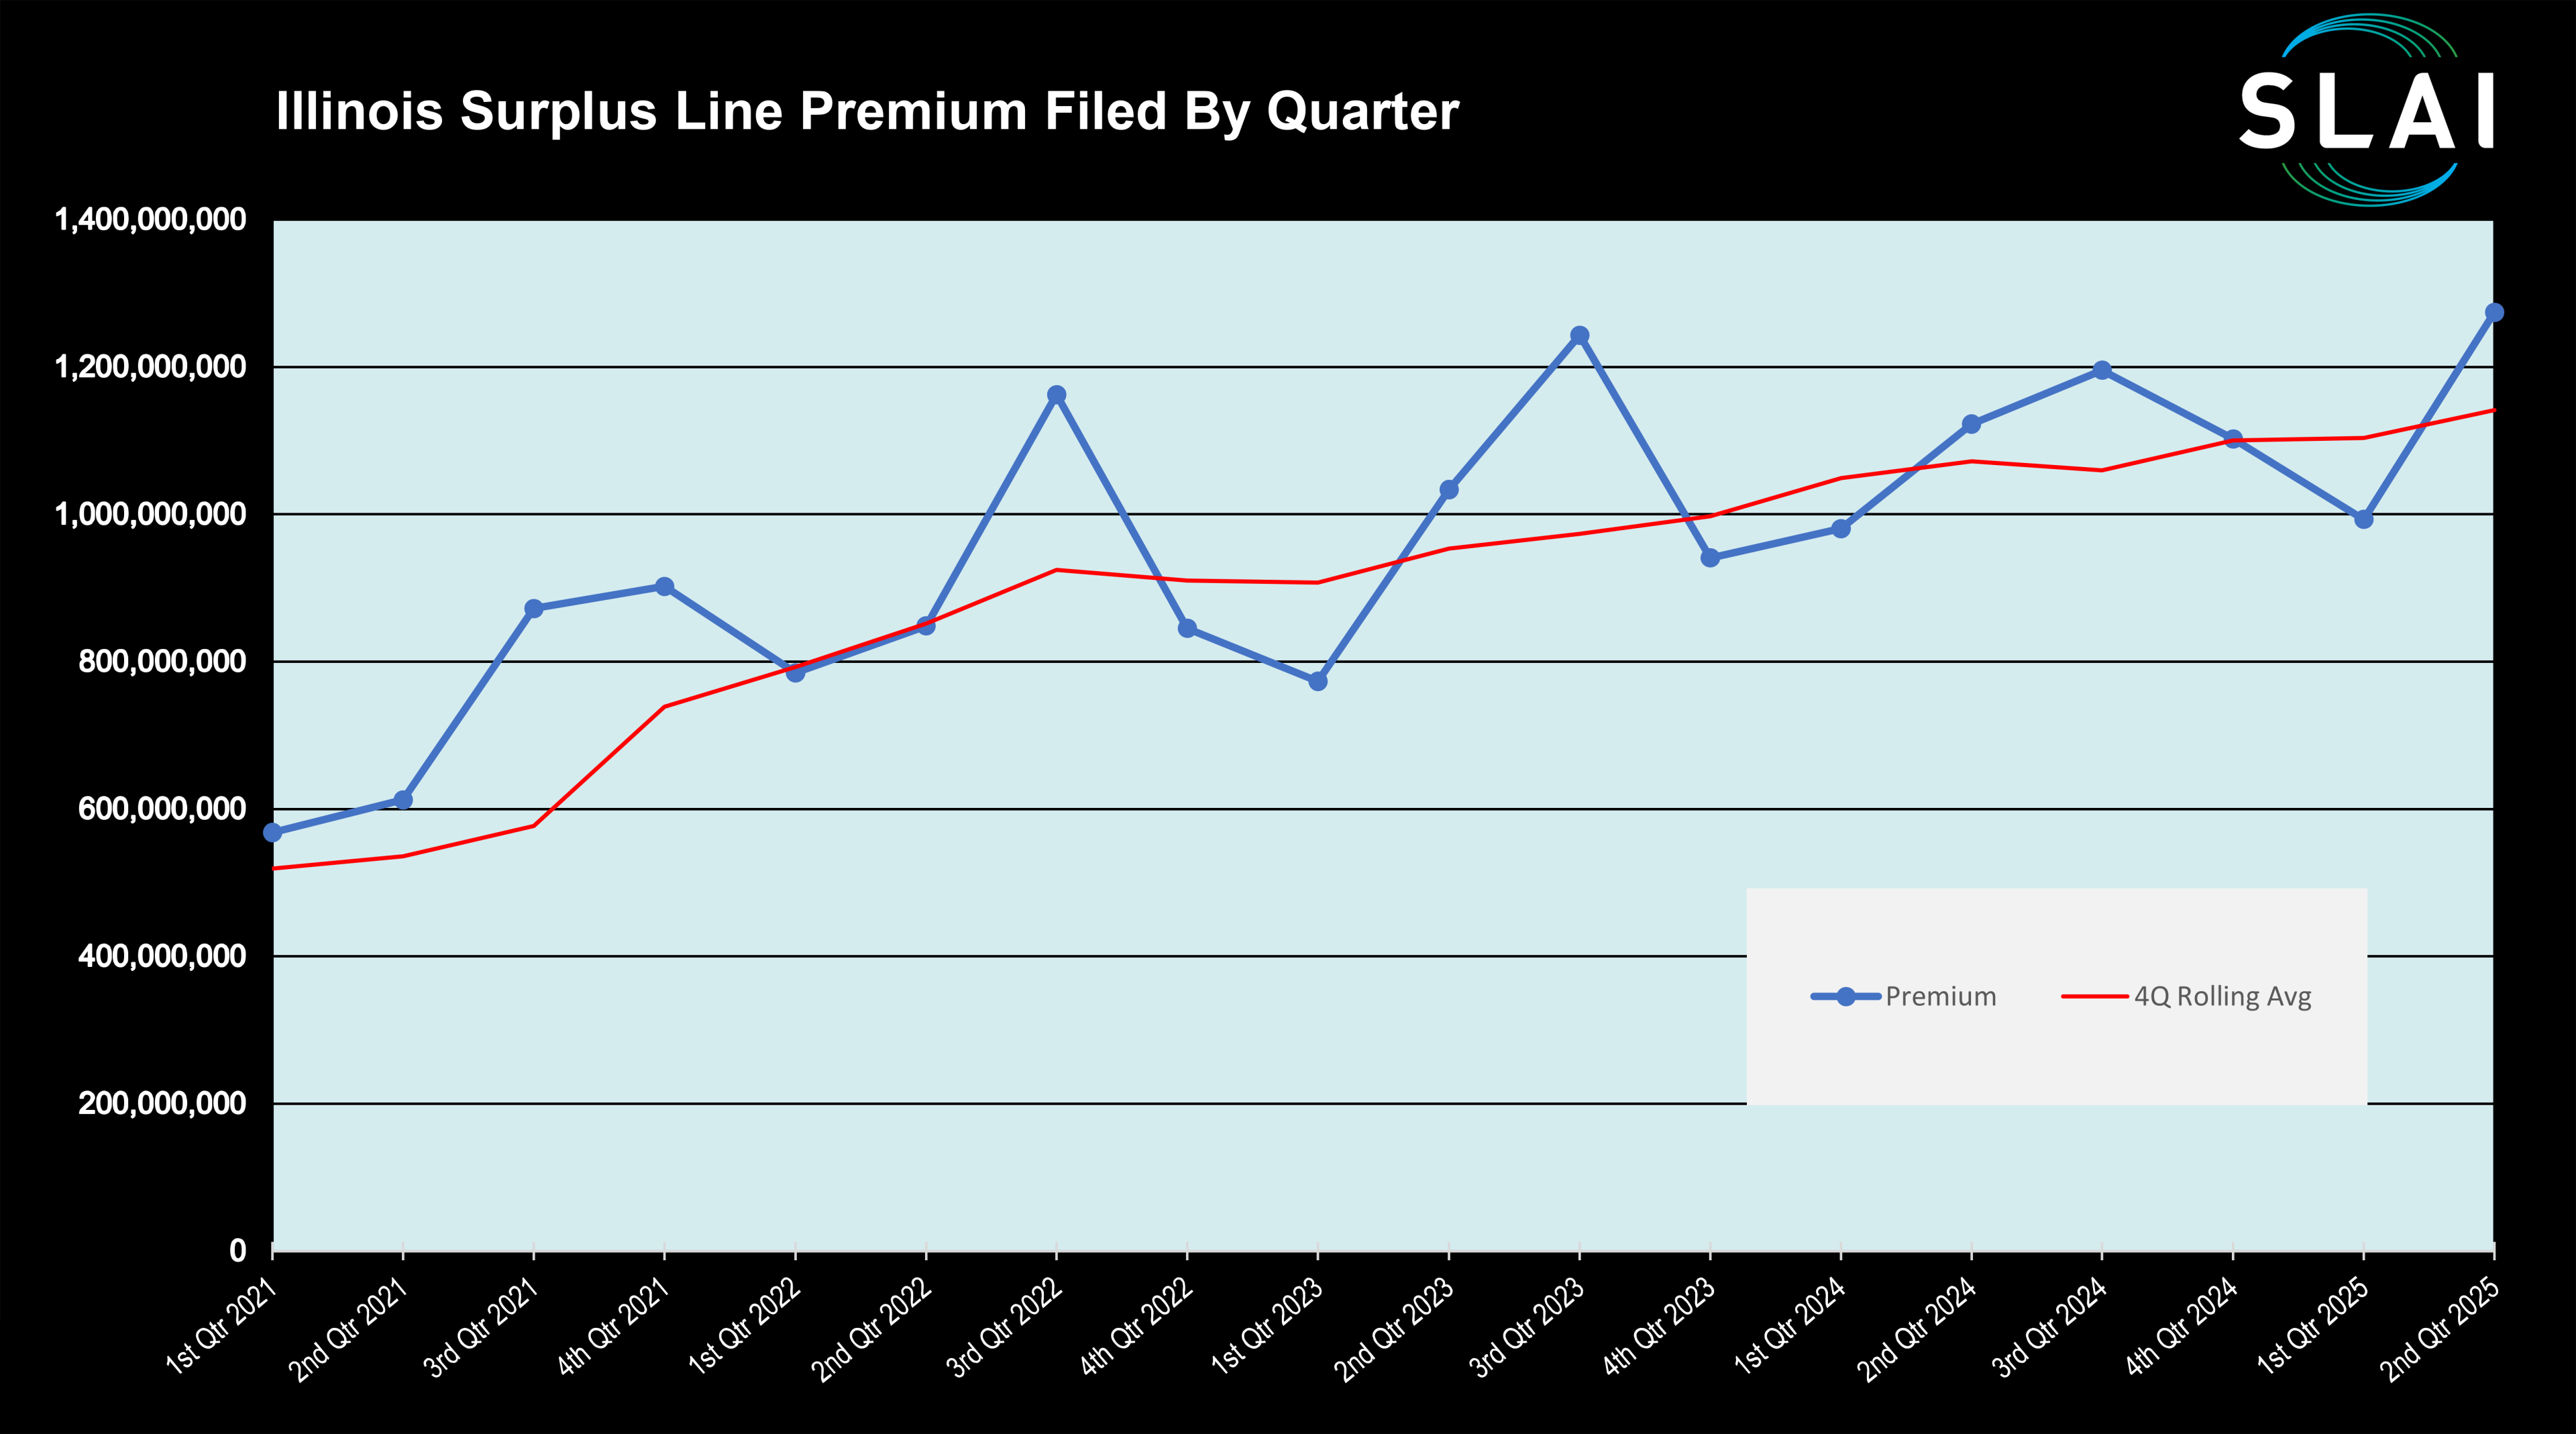
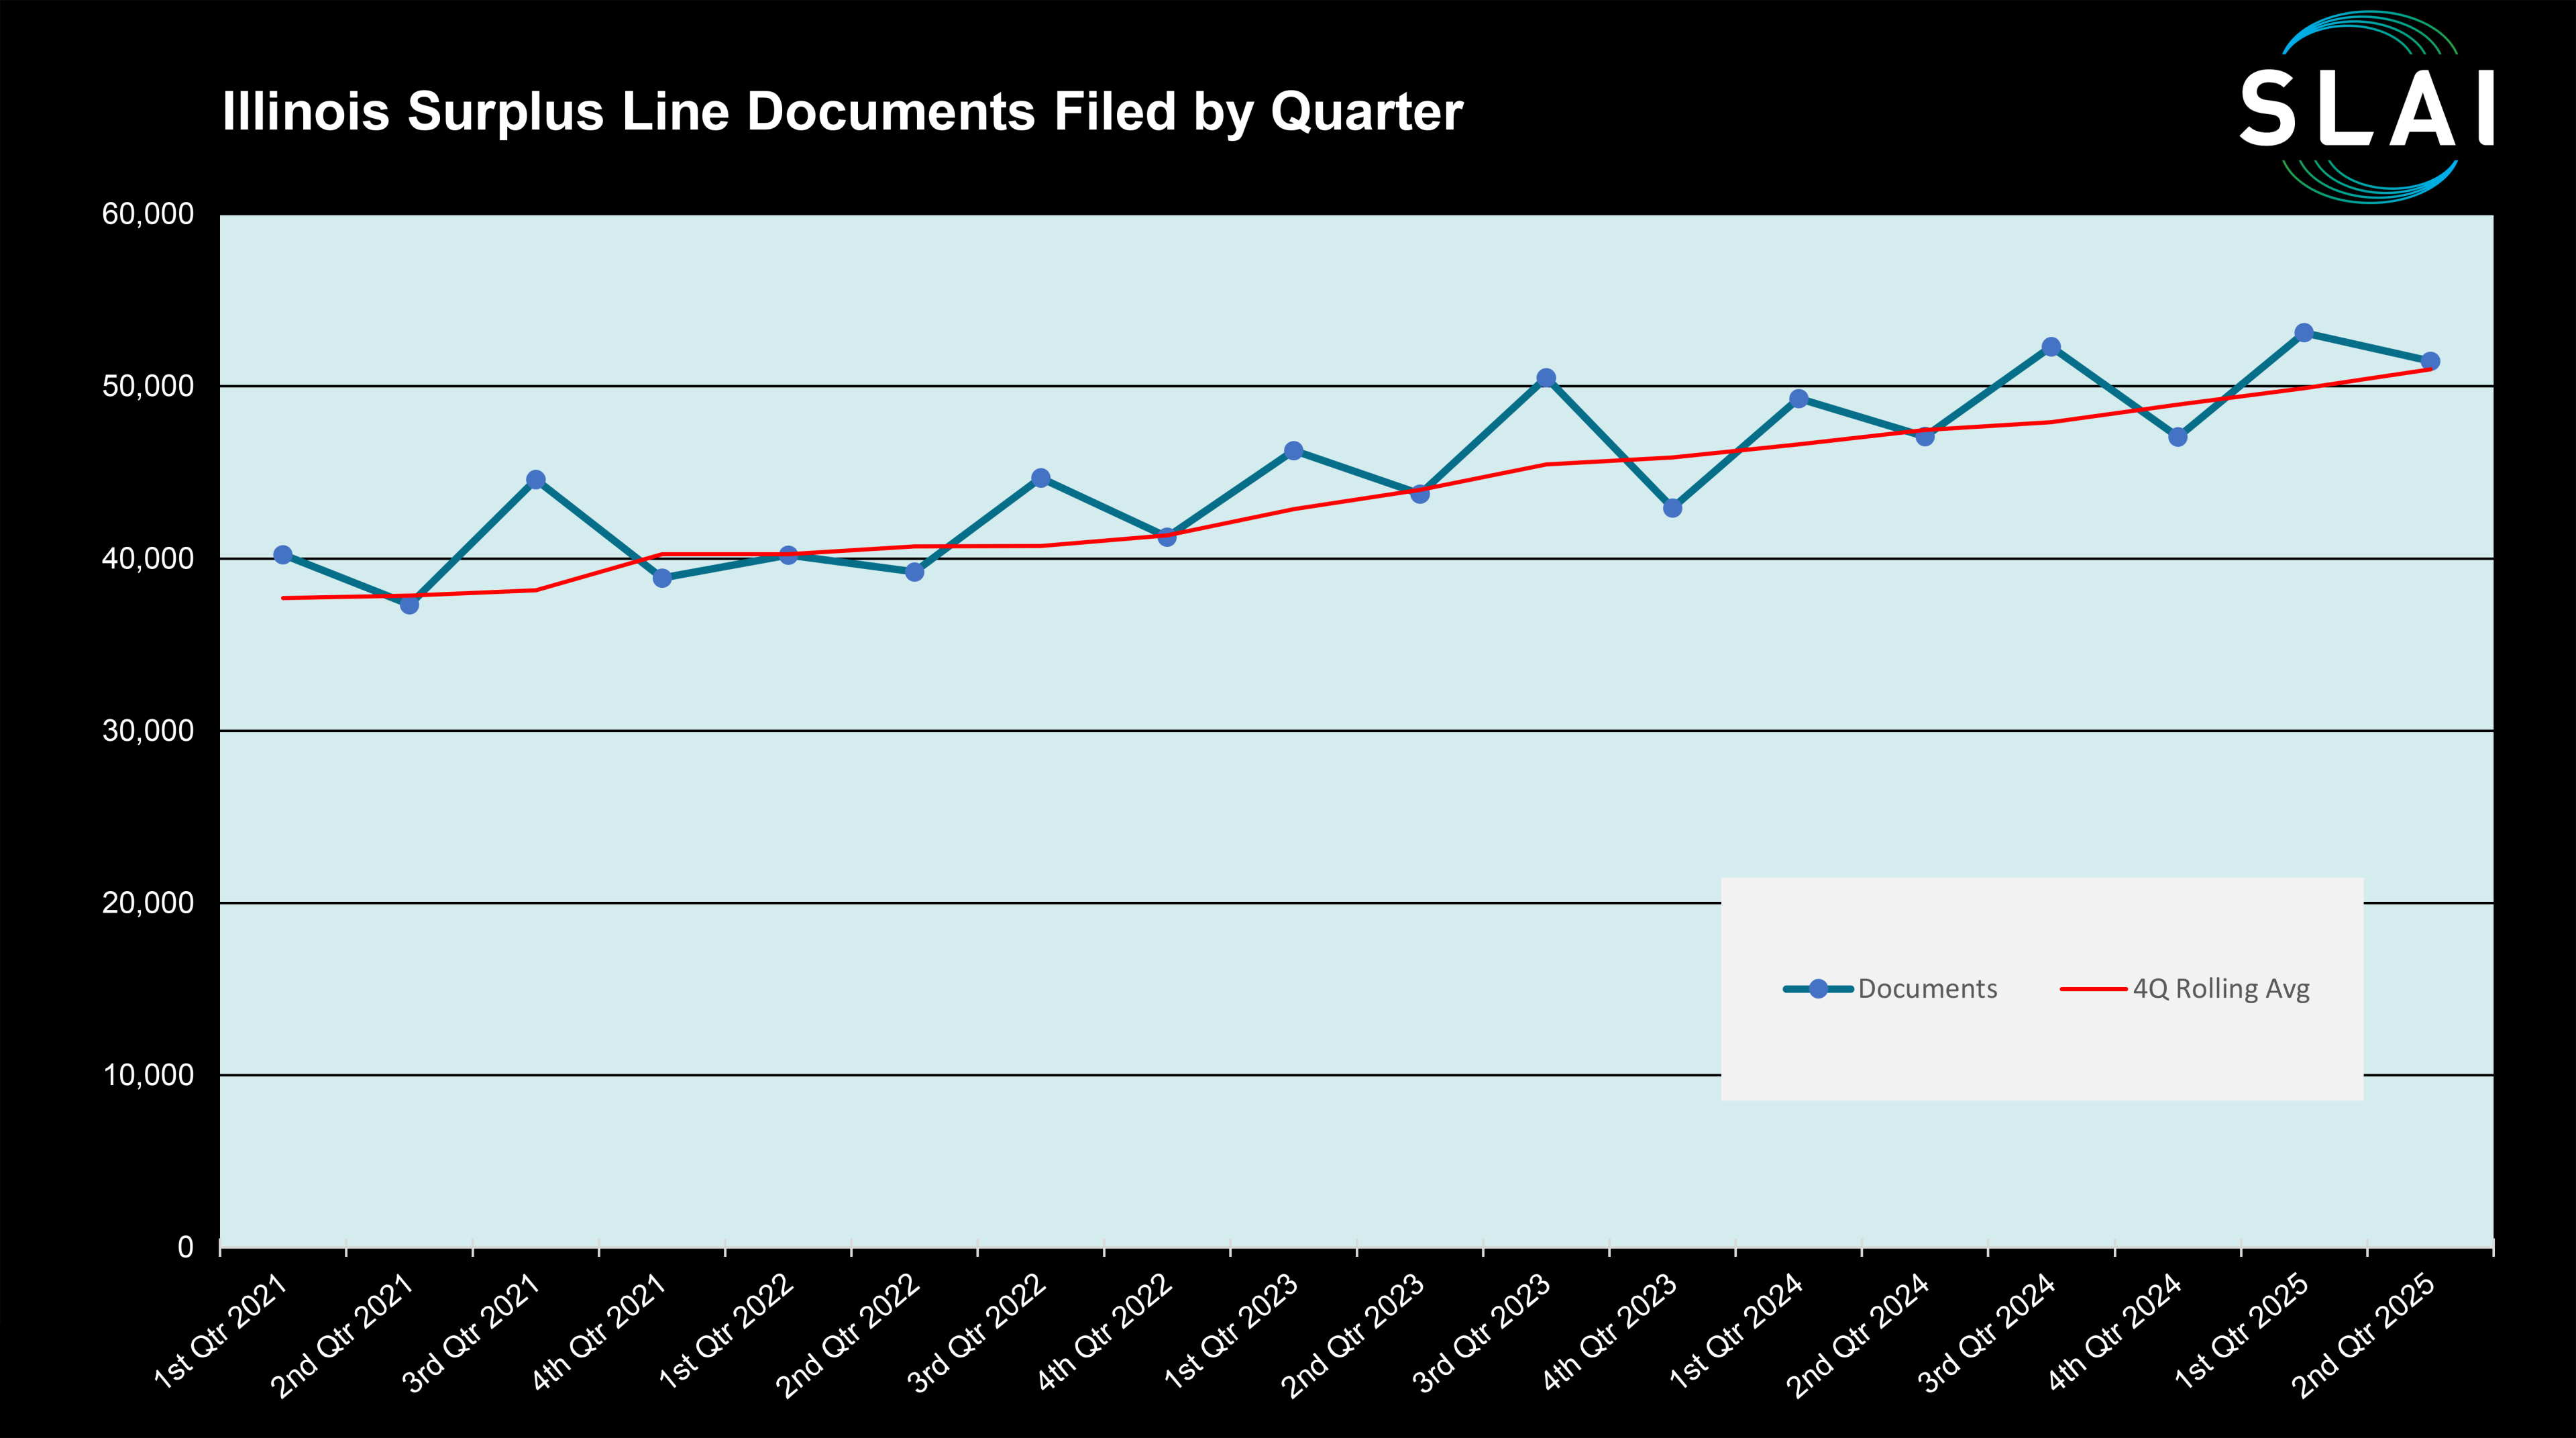
Graphs
| Top 50 Insurers by Premium Volume |
|---|
| Insurance Company Name | Jan-Jun 2025 | Jan-Jun 2024 | % Incr |
|---|
| Rank | Premium | Rank | Premium | (Decr) |
|---|
| Lloyd’s of London | − | 1 | $340,741,894 | 1 | $378,170,508 | -10% |
| Lexington Insurance Co | ↑ | 2 | 64,321,225 | 3 | 70,377,994 | -9% |
| Liberty Surplus Insurance Co | ↓ | 3 | 60,850,627 | 2 | 77,628,384 | -22% |
| Landmark American Insurance Co | − | 4 | 59,024,113 | 4 | 61,703,723 | -4% |
| National Fire & Marine Insurance Co | − | 5 | 53,831,081 | 5 | 61,130,609 | -12% |
| Starr Surplus Lines Insurance Co | − | 6 | 45,525,003 | 6 | 49,182,886 | -7% |
| Endurance American Specialty Insurance Co | ↑ | 7 | 37,911,721 | 10 | 38,354,905 | -1% |
| Evanston Insurance Co | ↑ | 8 | 36,416,716 | 11 | 36,894,602 | -1% |
| Scottsdale Insurance Co | ↑ | 9 | 35,547,516 | 16 | 31,969,987 | 11% |
| Columbia Casualty Co | ↓ | 10 | 34,745,246 | 8 | 39,135,272 | -11% |
| Indian Harbor Insurance Co | ↓ | 11 | 32,658,657 | 7 | 41,869,614 | -22% |
| Ironshore Specialty Insurance Co | ↑ | 12 | 29,760,679 | 15 | 33,731,289 | -12% |
| AIG Specialty Insurance Co | ↑ | 13 | 28,608,513 | 19 | 28,624,600 | 0% |
| Swiss Re Corporate Solutions Capacity Insurance Corp | ↓ | 14 | 27,636,305 | 9 | 39,131,807 | -29% |
| Interstate Fire & Casualty Co | ↓ | 15 | 26,880,849 | 12 | 35,170,575 | -24% |
| Arch Specialty Insurance Co | ↑ | 16 | 24,794,230 | 20 | 27,313,238 | -9% |
| AXIS Surplus Insurance Co | ↓ | 17 | 24,521,939 | 14 | 34,559,666 | -29% |
| Illinois Union Insurance Co | ↑ | 18 | 23,980,149 | 23 | 24,553,535 | -2% |
| Travelers Excess & Surplus Lines Co | ↓ | 19 | 23,939,387 | 13 | 35,076,862 | -32% |
| Gemini Insurance Co | ↑ | 20 | 23,088,382 | 26 | 20,458,648 | 13% |
| Aspen Specialty Insurance Co | ↑ | 21 | 22,894,535 | 34 | 16,864,534 | 36% |
| Everest Indemnity Insurance Co | ↑ | 22 | 21,806,756 | 31 | 18,306,491 | 19% |
| Westchester Surplus Lines Insurance Co | ↓ | 23 | 21,666,604 | 21 | 26,147,388 | -17% |
| Houston Casualty Co | ↓ | 24 | 20,991,498 | 17 | 29,979,205 | -30% |
| Steadfast Insurance Co | ↓ | 25 | 20,900,533 | 22 | 24,907,208 | -16% |
| Cincinnati Specialty Underwriters Insurance Co | ↓ | 26 | 18,318,371 | 25 | 22,482,446 | -19% |
| Crum & Forster Specialty Insurance Co | − | 27 | 17,758,275 | 27 | 20,399,906 | -13% |
| Navigators Specialty Insurance Co | ↑ | 28 | 17,019,878 | 30 | 19,402,289 | -12% |
| Starstone Specialty Insurance Co | ↓ | 29 | 16,836,177 | 24 | 23,305,201 | -28% |
| Great American E&S Insurance Co | ↑ | 30 | 16,592,821 | 39 | 13,534,409 | 23% |
| Admiral Insurance Co | ↑ | 31 | 16,098,762 | 32 | 18,098,329 | -11% |
| Chubb Custom Insurance Co | ↓ | 32 | 15,998,704 | 29 | 19,660,375 | -19% |
| Kinsale Insurance Co | ↓ | 33 | 15,021,215 | 28 | 20,038,465 | -25% |
| General Star Indemnity Co | ↓ | 34 | 14,720,886 | 33 | 17,596,975 | -16% |
| North American Capacity Insurance Co | ↑ | 35 | 13,955,325 | 112 | 2,841,855 | 391% |
| Nautilus Insurance Co | ↓ | 36 | 13,746,590 | 35 | 16,331,699 | -16% |
| QBE Specialty Insurance Co | ↑ | 37 | 13,083,665 | 38 | 13,665,279 | -4% |
| Hudson Excess Insurance Co | ↓ | 38 | 12,860,026 | 18 | 29,621,152 | -57% |
| Allied World Assurance Co (US) Inc | ↑ | 39 | 12,804,356 | 48 | 10,948,220 | 17% |
| Allied World Surplus Lines Insurance Co | ↑ | 40 | 11,423,717 | 46 | 11,428,811 | 0% |
| James River Insurance Co | ↓ | 41 | 10,999,827 | 37 | 13,793,840 | -20% |
| Southlake Specialty Insurance Co | ↑ | 42 | 9,926,934 | 49 | 10,930,965 | -9% |
| Bridgeway Insurance Company | ↑ | 43 | 9,827,953 | 51 | 10,581,150 | -7% |
| Ascot Specialty Insurance Co | ↑ | 44 | 9,223,163 | 54 | 9,318,616 | -1% |
| Princeton Excess and Surplus Lines Insurance Co | ↑ | 45 | 9,207,544 | 55 | 9,202,001 | 0% |
| Trisura Specialty Insurance Co | ↑ | 46 | 9,151,772 | 65 | 7,053,327 | 30% |
| Old Republic Union Insurance Co | ↑ | 47 | 9,144,809 | 56 | 9,050,982 | 1% |
| HDI Global Specialty SE | ↓ | 48 | 8,747,243 | 36 | 16,223,138 | -46% |
| Westfield Specialty Insurance Company | ↓ | 49 | 8,719,741 | 47 | 10,950,162 | -20% |
| Convex Insurance UK Ltd | ↓ | 50 | 8,443,130 | 41 | 12,594,788 | -33% |
| | | | | | | |
Back to Top
| Premium by Coverage Code Comparison to Prior Year (Summary) |
|---|
| Code | Description | All Documents (Policies & Endorsements) |
|---|
| YTD Premiums Filed | YTD Documents Filed |
|---|
| 2025-06 | 2024-06 | % Chg | 2025-06 | 2024-06 | % Chg |
|---|
| 1000 | Property | $99,861,015 | $76,675,034 | 30.2% | 9,529 | 9,653 | -1.3% |
| 1500 | Crop Hail | -3,141,975 | 61,349 | -5221.5% | 11 | 10 | 10.0% |
| 1700 | DIC | 959,445 | 1,332,217 | -28.0% | 42 | 87 | -51.7% |
| 2000 | Multi-Peril | 45,059,922 | 40,042,475 | 12.5% | 8,481 | 6,070 | 39.7% |
| 2200 | All Risk | 533,285,798 | 462,263,648 | 15.4% | 11,212 | 7,999 | 40.2% |
| 3000 | Inland Marine | 37,882,897 | 26,093,324 | 45.2% | 3,902 | 4,195 | -7.0% |
| 3200 | Aviation | 1,674,147 | 836,525 | 100.1% | 18 | 14 | 28.6% |
| 3500 | Glass | 117,740 | 1,013 | 11522.9% | 1 | 1 | 0.0% |
| 4000 | E & O | 192,078,345 | 213,856,990 | -10.2% | 6,232 | 6,429 | -3.1% |
| 4500 | Personal Accident | 8,770,693 | 14,627,788 | -40.0% | 2,326 | 2,375 | -2.1% |
| 4600 | Medical | 9,006,004 | 6,651,200 | 35.4% | 634 | 724 | -12.4% |
| 5000 | GL | 965,541,642 | 878,891,142 | 9.9% | 47,888 | 46,075 | 3.9% |
| 5100 | Med Mal | 61,370,435 | 71,789,744 | -14.5% | 1,121 | 765 | 46.5% |
| 5200 | Liquor | 445,165 | 296,677 | 50.1% | 106 | 43 | 146.5% |
| 5300 | RR & Util Liab | 1,927,677 | 905,926 | 112.8% | 25 | 15 | 66.7% |
| 5500 | Umbrella | 84,079,509 | 114,076,457 | -26.3% | 1,333 | 1,328 | 0.4% |
| 6000 | Work Comp | 3,561,941 | 1,053,687 | 238.0% | 24 | 71 | -66.2% |
| 7000 | Fidelity/Surety | 6,427,706 | 5,737,053 | 12.0% | 990 | 1,217 | -18.7% |
| 7100 | Crime | 1,393,557 | 2,029,454 | -31.3% | 202 | 211 | -4.3% |
| 7500 | Auto Liab | 132,418,260 | 121,387,029 | 9.1% | 2,830 | 2,517 | 12.4% |
| 7700 | Auto Phys Dam | 74,864,872 | 61,391,209 | 21.9% | 6,289 | 5,921 | 6.2% |
| 8000 | Use & Occ | 199,937 | 4,062 | 4822.1% | 511 | 0 | 100.0% |
| 9900 | Misc | 9,569,549 | 2,875,253 | 232.8% | 854 | 664 | 28.6% |
| Totals | $2,267,354,281 | $2,102,879,256 | 7.8% | 104,561 | 96,384 | 8.5% |
Back to Top
| Premium by Coverage Code Comparison to Prior Year (Detail) |
|---|
| Code | Description | All Documents (Policies & Endorsements) |
|---|
| YTD Premiums Filed | YTD Documents Filed | YTD Average Premium/Doc |
|---|
| 2025-06 | 2024-06 | % Chg | 2025-06 | 2024-06 | % Chg | 2025-06 | 2024-06 | % Chg |
|---|
| 1001 | Property: Fire | $56,367,230 | $51,161,075 | 10.2% | 4,191 | 5,148 | -18.6% | $13,450 | $9,938 | 35.3% |
| 1002 | Property: Allied Lines | 6,667,950 | 4,670,217 | 42.8% | 215 | 144 | 49.3% | 31,014 | 32,432 | -4.4% |
| 1003 | Property: Excess of Loss | 3,986,057 | 3,198,217 | 24.6% | 114 | 115 | -0.9% | 34,965 | 27,811 | 25.7% |
| 1004 | Property: Earthquake | 3,130,831 | 1,474,652 | 112.3% | 143 | 125 | 14.4% | 21,894 | 11,797 | 85.6% |
| 1005 | Property: Commercial Flood | 8,873,160 | 5,281,943 | 68.0% | 1,126 | 988 | 14.0% | 7,880 | 5,346 | 47.4% |
| 1006 | Property: Terrorism (Property) | 16,209,643 | 7,450,141 | 117.6% | 319 | 211 | 51.2% | 50,814 | 35,309 | 43.9% |
| 1007 | Property: Windstorm | 2,226,163 | 1,515,400 | 46.9% | 201 | 142 | 41.5% | 11,075 | 10,672 | 3.8% |
| 1008 | Property: Private Flood | 2,402,978 | 1,922,034 | 25.0% | 3,215 | 2,779 | 15.7% | 747 | 692 | 8.1% |
| 1009 | Property: Excess Mine Subsidence | -2,997 | 1,355 | -321.2% | 5 | 1 | 400.0% | -599 | 1,355 | -144.2% |
| 1500 | Crop Hail: All | -3,141,975 | 61,349 | -5221.5% | 11 | 10 | 10.0% | -285,634 | 6,135 | -4755.9% |
| 1700 | DIC: All | 959,445 | 1,332,217 | -28.0% | 42 | 87 | -51.7% | 22,844 | 15,313 | 49.2% |
| 2001 | Multi-Peril: Farmowners | 112,166 | 430,505 | -73.9% | 18 | 33 | -45.5% | 6,231 | 13,046 | -52.2% |
| 2002 | Multi-Peril: Homeowners | 5,852,460 | 3,336,789 | 75.4% | 1,756 | 1,340 | 31.0% | 3,333 | 2,490 | 33.8% |
| 2003 | Multi-Peril: CMP / SMP | 36,952,172 | 28,513,246 | 29.6% | 4,140 | 3,325 | 24.5% | 8,926 | 8,575 | 4.1% |
| 2004 | Multi-Peril: Multi-Line | 3,320,598 | 3,934,993 | -15.6% | 2,321 | 1,061 | 118.8% | 1,431 | 3,709 | -61.4% |
| 2005 | Multi-Peril: Terrorism (Combo) | -1,177,474 | 3,826,942 | -130.8% | 246 | 311 | -20.9% | -4,786 | 12,305 | -138.9% |
| 2200 | All Risk: All | 533,285,798 | 462,263,648 | 15.4% | 11,212 | 7,999 | 40.2% | 47,564 | 57,790 | -17.7% |
| 3001 | Inland Marine: Jewl/Fur Block, Floaters | 14,931,758 | 7,518,131 | 98.6% | 708 | 697 | 1.6% | 21,090 | 10,786 | 95.5% |
| 3002 | Inland Marine: Other | 22,906,378 | 18,532,820 | 23.6% | 3,186 | 3,480 | -8.4% | 7,190 | 5,326 | 35.0% |
| 3003 | Inland Marine: Watercraft | 44,761 | 42,373 | 5.6% | 8 | 18 | -55.6% | 5,595 | 2,354 | 137.7% |
| 3200 | Aviation: Phys Dam – All | 0 | 162,856 | -100.0% | 0 | 5 | -100.0% | 0 | 32,571 | -100.0% |
| 3201 | Aviation: Liability-Drones | 17,500 | 3,972 | 340.6% | 2 | 1 | 100.0% | 8,750 | 3,972 | 120.3% |
| 3202 | Aviation: Liability-Other | 1,656,647 | 669,697 | 147.4% | 16 | 8 | 100.0% | 103,540 | 83,712 | 23.7% |
| 3500 | Glass: All | 117,740 | 1,013 | 11522.9% | 1 | 1 | 0.0% | 117,740 | 1,013 | 11522.9% |
| 4001 | E & O: D & O | 22,520,751 | 26,804,829 | -16.0% | 764 | 776 | -1.5% | 29,477 | 34,542 | -14.7% |
| 4002 | E & O: Other | 142,546,200 | 159,664,503 | -10.7% | 4,891 | 5,079 | -3.7% | 29,145 | 31,436 | -7.3% |
| 4003 | E & O: Atty Malpractice | 14,103,223 | 14,650,986 | -3.7% | 274 | 299 | -8.4% | 51,472 | 49,000 | 5.0% |
| 4004 | E & O: Architects & Engineers | 10,850,487 | 10,108,023 | 7.3% | 277 | 244 | 13.5% | 39,171 | 41,426 | -5.4% |
| 4005 | E & O: Fiduciary Liability | 2,057,684 | 2,628,649 | -21.7% | 26 | 31 | -16.1% | 79,142 | 84,795 | -6.7% |
| 4500 | Personal Accident: All | 8,770,693 | 14,627,788 | -40.0% | 2,326 | 2,375 | -2.1% | 3,771 | 6,159 | -38.8% |
| 4600 | Medical: All | 9,006,004 | 6,651,200 | 35.4% | 634 | 724 | -12.4% | 14,205 | 9,187 | 54.6% |
| 5001 | GL: CGL | 255,148,729 | 227,997,274 | 11.9% | 26,540 | 24,644 | 7.7% | 9,614 | 9,252 | 3.9% |
| 5002 | GL: Products | 37,170,942 | 41,792,397 | -11.1% | 590 | 677 | -12.9% | 63,002 | 61,732 | 2.1% |
| 5003 | GL: Excess CGL | 360,280,883 | 248,736,084 | 44.8% | 8,966 | 7,695 | 16.5% | 40,183 | 32,324 | 24.3% |
| 5004 | GL: Misc | 69,495,001 | 97,630,691 | -28.8% | 2,766 | 4,029 | -31.3% | 25,125 | 24,232 | 3.7% |
| 5005 | GL: Municipalities | 3,069,460 | 1,059,891 | 189.6% | 23 | 20 | 15.0% | 133,455 | 52,995 | 151.8% |
| 5006 | GL: School Districts | 4,546 | 21,439 | -78.8% | 6 | 18 | -66.7% | 758 | 1,191 | -36.4% |
| 5007 | GL: Other Political Subdivisions | 13,533 | 2,369,628 | -99.4% | 3 | 4 | -25.0% | 4,511 | 592,407 | -99.2% |
| 5008 | GL: Public Officials | 1,884 | 61,232 | -96.9% | 0 | 2 | -100.0% | 0 | 30,616 | -100.0% |
| 5009 | GL: Day Care Ctrs | 31,815 | 30,295 | 5.0% | 13 | 7 | 85.7% | 2,447 | 4,328 | -43.5% |
| 5010 | GL: Labor, Fraternal & Relig Orgs | 58,111 | 47,544 | 22.2% | 15 | 19 | -21.1% | 3,874 | 2,502 | 54.8% |
| 5011 | GL: Asbestos Lead | 240,736 | 250,346 | -3.8% | 35 | 117 | -70.1% | 6,878 | 2,140 | 221.5% |
| 5012 | GL: Cyber | 179,739,695 | 189,650,532 | -5.2% | 5,642 | 5,483 | 2.9% | 31,857 | 34,589 | -7.9% |
| 5013 | GL: EPL | 7,190,416 | 6,650,205 | 8.1% | 556 | 566 | -1.8% | 12,932 | 11,749 | 10.1% |
| 5014 | GL: Event Cancellation | 2,353,481 | 2,081,153 | 13.1% | 182 | 145 | 25.5% | 12,931 | 14,353 | -9.9% |
| 5015 | GL: Mortgage Impairment | 39,318 | 91,908 | -57.2% | 4 | 14 | -71.4% | 9,830 | 6,565 | 49.7% |
| 5016 | GL: Patent/Trademark/Copyright | 148,384 | 200,625 | -26.0% | 2 | 8 | -75.0% | 74,192 | 25,078 | 195.8% |
| 5017 | GL: Pollution | 47,019,480 | 55,748,258 | -15.7% | 2,272 | 2,356 | -3.6% | 20,695 | 23,662 | -12.5% |
| 5018 | GL: Prize Indemnity | 322,349 | 330,156 | -2.4% | 30 | 33 | -9.1% | 10,745 | 10,005 | 7.4% |
| 5019 | GL: Event Liability | 1,173,378 | 520,525 | 125.4% | 103 | 95 | 8.4% | 11,392 | 5,479 | 107.9% |
| 5020 | GL: Terrorism (Liability) | 1,556,798 | 3,043,451 | -48.8% | 87 | 76 | 14.5% | 17,894 | 40,045 | -55.3% |
| 5021 | GL: Cannabis Dispensaries | 249,140 | 414,348 | -39.9% | 35 | 43 | -18.6% | 7,118 | 9,636 | -26.1% |
| 5022 | GL: Cannabis Cultivators | 233,563 | 163,160 | 43.1% | 18 | 24 | -25.0% | 12,976 | 6,798 | 90.9% |
| 5101 | Med Mal: Beauty / Fitness / Barber | 784,343 | 1,011,328 | -22.4% | 38 | 63 | -39.7% | 20,641 | 16,053 | 28.6% |
| 5102 | Med Mal: Hosp, Rest Home, Clinic, Lab, Ambulance | 19,296,636 | 20,992,099 | -8.1% | 159 | 164 | -3.0% | 121,362 | 128,001 | -5.2% |
| 5103 | Med Mal: Doctors | 6,484,595 | 3,019,646 | 114.7% | 68 | 78 | -12.8% | 95,362 | 38,713 | 146.3% |
| 5104 | Med Mal: Dentists | 7,756,801 | 25,491,248 | -69.6% | 17 | 19 | -10.5% | 456,282 | 1,341,645 | -66.0% |
| 5105 | Med Mal: Nurses | 121,009 | 734,758 | -83.5% | 10 | 25 | -60.0% | 12,101 | 29,390 | -58.8% |
| 5106 | Med Mal: Druggists/Pharmacists | 54,882 | 0 | 100.0% | 1 | 0 | 100.0% | 54,882 | 0 | 100.0% |
| 5107 | Med Mal: Other | 26,872,169 | 20,540,665 | 30.8% | 828 | 416 | 99.0% | 32,454 | 49,377 | -34.3% |
| 5200 | Liquor: All | 445,165 | 296,677 | 50.1% | 106 | 43 | 146.5% | 4,200 | 6,899 | -39.1% |
| 5301 | RR & Util Liab: RR Protective | 925,470 | 246,489 | 275.5% | 13 | 8 | 62.5% | 71,190 | 30,811 | 131.1% |
| 5302 | RR & Util Liab: Other | 1,002,207 | 659,437 | 52.0% | 12 | 7 | 71.4% | 83,517 | 94,205 | -11.3% |
| 5500 | Umbrella: All | 84,079,509 | 114,076,457 | -26.3% | 1,333 | 1,328 | 0.4% | 63,075 | 85,901 | -26.6% |
| 6000 | Work Comp: All Others | 3,561,941 | 1,053,687 | 238.0% | 24 | 71 | -66.2% | 148,414 | 14,841 | 900.1% |
| 6001 | Work Comp: Cannabis Dispensaries | 0 | 0 | 0.0% | 0 | 0 | 0.0% | 0 | 0 | 0.0% |
| 6002 | Work Comp: Cannabis Cultivators | 0 | 0 | 0.0% | 0 | 0 | 0.0% | 0 | 0 | 0.0% |
| 7001 | Fidelity/Surety: Fidelity/Forgery/Bankers Bond | 524,408 | 2,109,263 | -75.1% | 54 | 80 | -32.5% | 9,711 | 26,366 | -63.2% |
| 7002 | Fidelity/Surety: Performance Bond | 3,403,715 | 319,535 | 965.2% | 150 | 109 | 37.6% | 22,691 | 2,932 | 674.1% |
| 7003 | Fidelity/Surety: Surety Bond – All Others | 2,499,583 | 3,308,255 | -24.4% | 786 | 1,028 | -23.5% | 3,180 | 3,218 | -1.2% |
| 7004 | Fidelity/Surety: Surety Bond – Cannabis Dispensaries | 0 | 0 | 0.0% | 0 | 0 | 0.0% | 0 | 0 | 0.0% |
| 7101 | Crime: Burglary & Robbery | 28,907 | 418,078 | -93.1% | 68 | 80 | -15.0% | 425 | 5,226 | -91.9% |
| 7102 | Crime: Kidnap & Ransom | 16,169 | 3,042 | 431.5% | 8 | 11 | -27.3% | 2,021 | 277 | 630.8% |
| 7103 | Crime: Other | 1,348,481 | 1,608,334 | -16.2% | 126 | 120 | 5.0% | 10,702 | 13,403 | -20.1% |
| 7501 | Auto Liab: Private Passenger – All | 134,859 | 40,155 | 235.8% | 80 | 47 | 70.2% | 1,686 | 854 | 97.3% |
| 7502 | Auto Liab: Commercial – All Others | 131,615,760 | 119,816,400 | 9.8% | 2,697 | 2,402 | 12.3% | 48,801 | 49,882 | -2.2% |
| 7503 | Auto Liab: Taxicabs | 0 | 0 | 0.0% | 0 | 0 | 0.0% | 0 | 0 | 0.0% |
| 7504 | Auto Liab: Rentals | 76,395 | 240,961 | -68.3% | 22 | 10 | 120.0% | 3,473 | 24,096 | -85.6% |
| 7505 | Auto Liab: TNC | 591,246 | 1,289,513 | -54.1% | 31 | 58 | -46.6% | 19,072 | 22,233 | -14.2% |
| 7701 | Auto Phys Dam: Private Passenger – All | 355,909 | 1,259,220 | -71.7% | 144 | 89 | 61.8% | 2,472 | 14,149 | -82.5% |
| 7702 | Auto Phys Dam: Commercial – All Others | 74,384,411 | 60,025,974 | 23.9% | 6,134 | 5,781 | 6.1% | 12,127 | 10,383 | 16.8% |
| 7703 | Auto Phys Dam: Taxi/Limo | 62,302 | -49,882 | 224.9% | 1 | 4 | -75.0% | 62,302 | -12,471 | 599.6% |
| 7704 | Auto Phys Dam: TNC | 62,250 | 155,897 | -60.1% | 10 | 47 | -78.7% | 6,225 | 3,317 | 87.7% |
| 8001 | Use & Occ: Boiler & Machinery Direct | 3,127 | 1,325 | 136.0% | 1 | 0 | 100.0% | 3,127 | 0 | 100.0% |
| 8002 | Use & Occ: Boiler & Machinery Consequential | 124,340 | 2,737 | 4442.9% | 1 | 0 | 100.0% | 124,340 | 0 | 100.0% |
| 8003 | Use & Occ: Engine & Machinery | 0 | 0 | 0.0% | 0 | 0 | 0.0% | 0 | 0 | 0.0% |
| 8004 | Use & Occ: Other | 72,470 | 0 | 100.0% | 509 | 0 | 100.0% | 142 | 0 | 100.0% |
| 9900 | Misc: Misc | 9,569,549 | 2,875,253 | 232.8% | 854 | 664 | 28.6% | 11,206 | 4,330 | 158.8% |
| Totals | $2,267,354,281 | $2,102,879,256 | 7.8% | 104,561 | 96,384 | 8.5% | $21,685 | $21,818 | -0.6% |
Back to Top
2025 MID-YEAR, STATISTICS, STATS, DATA, PREMIUMS, DOCUMENTS, FILINGS